

Building a chatbot with Xenioo is definitively as easier as it gets.
Number of templates, tutorials, and the in-application information is growing and can guide you through the creation of perfect chatbot.
Indeed, the freedom and power you’re given can sometimes bring some questions during execution.
Let’s look at this very simple chatbot:
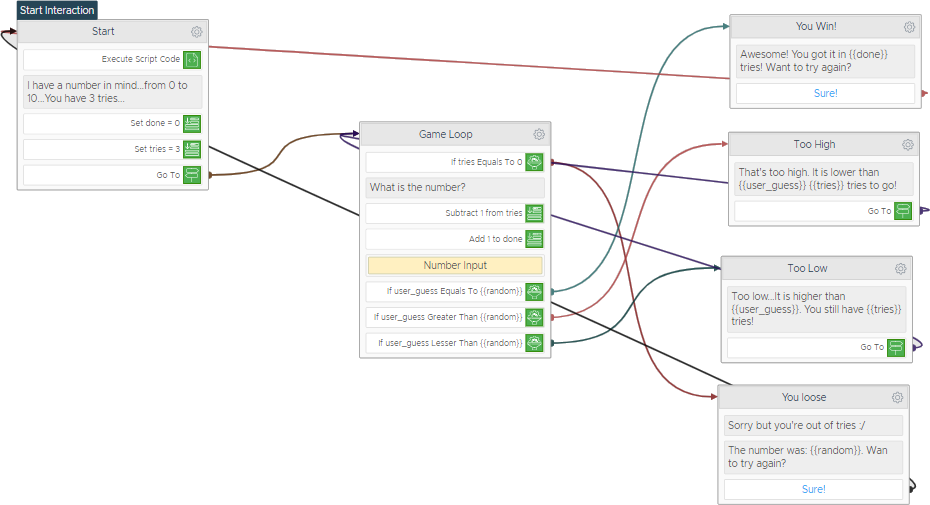
In just a few interactions, this chatbot is creating a small game. It creates a random number and asks the user to guess it. If the number is lower it will tell the user to raise the answer otherwise to lower it. If the user guesses the number in less than 3 turns its a win otherwise its a loss.
The flow is simple, yet full of redirections and variable handling: wouldn’t be great to execute the chatbot and not only see the results but check what is happening behind the scenes?
Execution Diagram To The Rescue
The Execution Diagram is a detailed step by step visual information log that can give you a tremendous help when diving into your chatbot execution bits.
It is activated by default whenever you start previewing your chatbot.
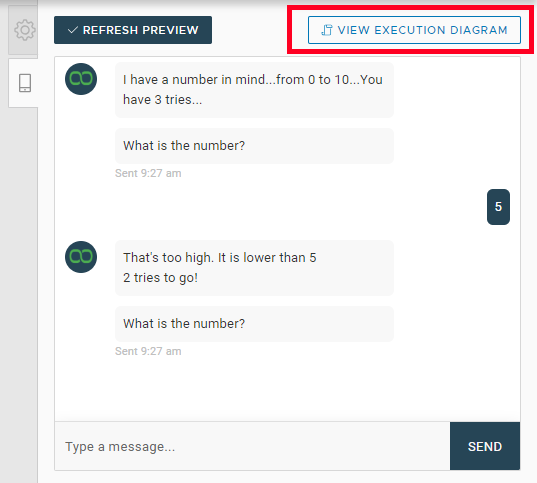
Whenever you want, during your chatbot preview, click on the button to check all chatbot execution steps in logic engine.
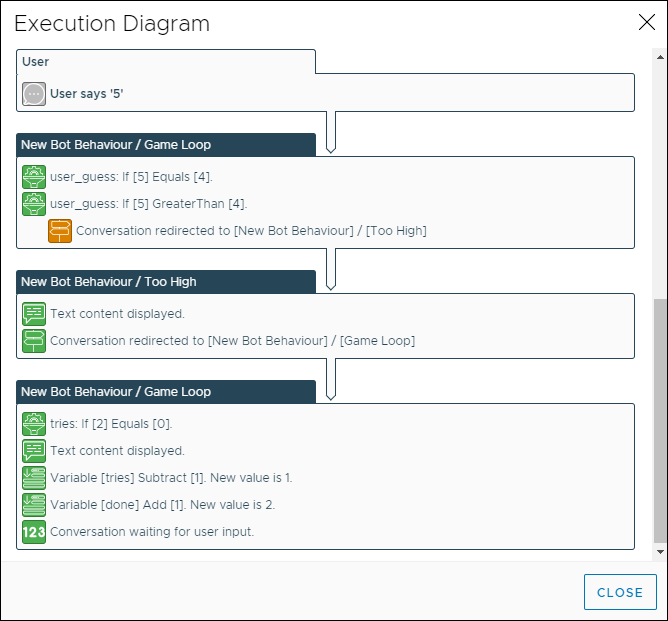
As you can see, everything is finely detailed.
The user input is triggering a variable check that you can verify and you see that when the number is greater than the guessed one. The logic engine executes a redirect to the message interaction.
Later, as the Game Loop interaction is executed again, you see how every variable step changes every value. Also, notice how each and every step has exactly the icon of the action that generated the output.
Are you using a lot of NLP processing? Are you using a Hybrid Xenioo/DialogFlow setup and wondering why and when
Now it is all here, available whenever you want it.
Checking Real Conversations
Testing and verifying your chatbot while building it is great but we all know that if something can happen. It will happen when a user does something unexpected or receives an unexpected output.
What happened there? Why? All of these questions can now be answered using Execution Diagram which of course, is also available for each and every conversation your chatbot is handling!
Just pick the user that is having issues and from the conversation gear menu icon, pick View -> Execution Diagram to open the full conversation execution history.
The Execution Diagram is a huge new feature that will help you check and verify all of the execution steps of you chatbot as they happen.
Checking why a variable receives a specific value or when a specific intent is triggered or even why a specific API call is failing: everything is now available to you!

It’s time to start building awesome chatbots with Xenioo!